View, track, and manage
your land for productivity gains
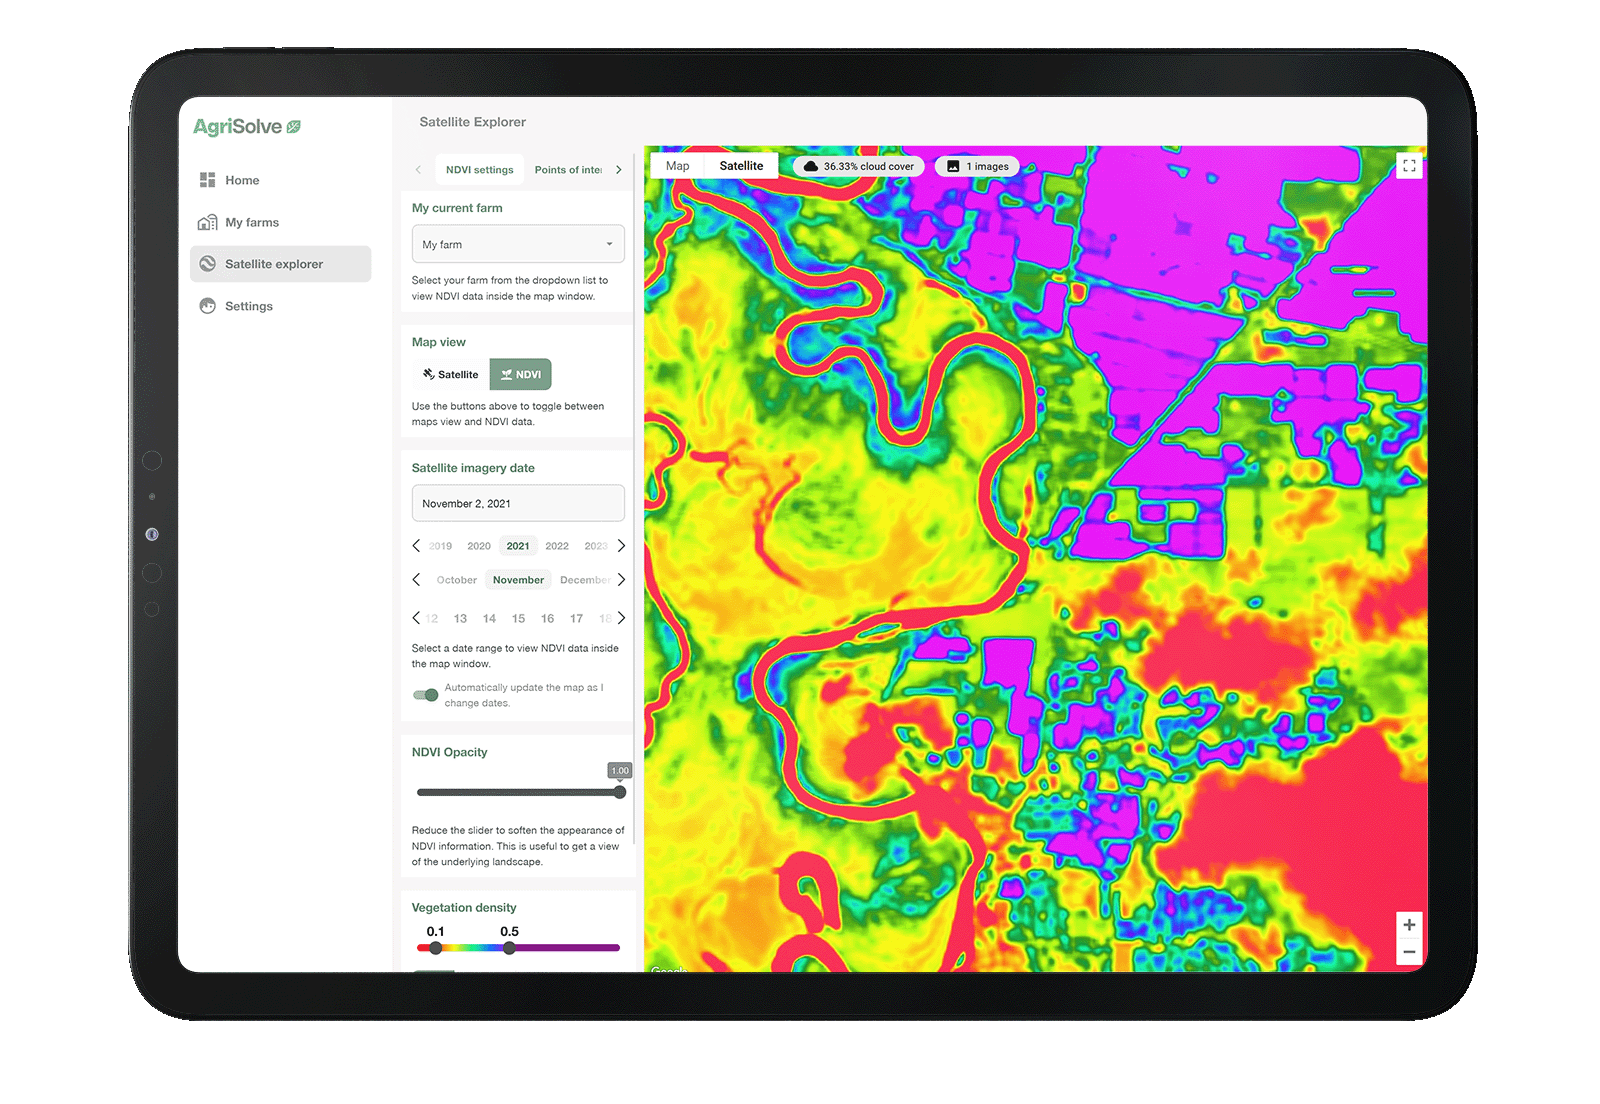
Use our drawing tool to select areas on the map, and then view data from 4 different satellites to interpret soil temperature, NDVI, and NDWI features for chosen date spans.
AgriSolve automatically steps you through the analysis process, providing suggestions for soil improvement, crop yield, and allowing you to watch changes over time.
Platform sponsors
![MR landscapes[2]](https://agrisolve.com.au/wp-content/uploads/2023/11/MR-landscapes2.png)

This project is supported by Mallee Sustainable Farming with funding from the Murraylands and Riverland Landscape Board Grassroots Grant.
Our web app makes it easy to view and analyze NDVI data for any area you’re interested in. Whether it’s for farming, environmental management, or forestry, you can quickly see how healthy vegetation is in a specific location. Just input the coordinates or draw a shape on the map, and you’ll get high-resolution NDVI images and tools for insights.
With our platform, you can compare NDVI data over time. Pick the dates you want to check, and see how vegetation has changed. It’s a valuable feature for tracking seasons, evaluating interventions, and making data-based choices. It’s handy for farmers, conservationists, and urban planners alike.
Keep records of important spots and events. You can add notes, images, and more to your Points of Interest (POIs). This feature is perfect for researchers, environmentalists, and anyone who needs to maintain a digital logbook of past observations. It’s a useful tool for tracking the history of specific areas or events.
Stay updated on the latest agricultural breakthroughs, trends, and innovations right here on our news page, where we bring you the freshest insights from the world of farming and agribusiness!
